ABA ROLI Presentation, June 8, 2016
This notebook was prepared for a presentation at the ABA's Rule of Law Institute, and contains all the code necessary to re-run the data analysis presented therein.
Replication information:
This document contains working Python code and output, mixed with text. For convenience, the two csv files containing the relevant data may be downloaded here and here. The slides underlying this presentation are available here. All libraries and tools are packaged into the excellent free Anaconda scientific Python distribution, which I highly recommend. I used Python 2, but it should work on the more modern Python 3 too (untested).
If you're done here, you can go back to The Rule of Law in the Real World.
%matplotlib inline
import numpy as np
import pylab as plt
import pandas as pd
import sklearn
rlrw = pd.read_csv("rlrw_scaled.csv")
wjp_bti = pd.read_csv("wjp_bti_scaled.csv")
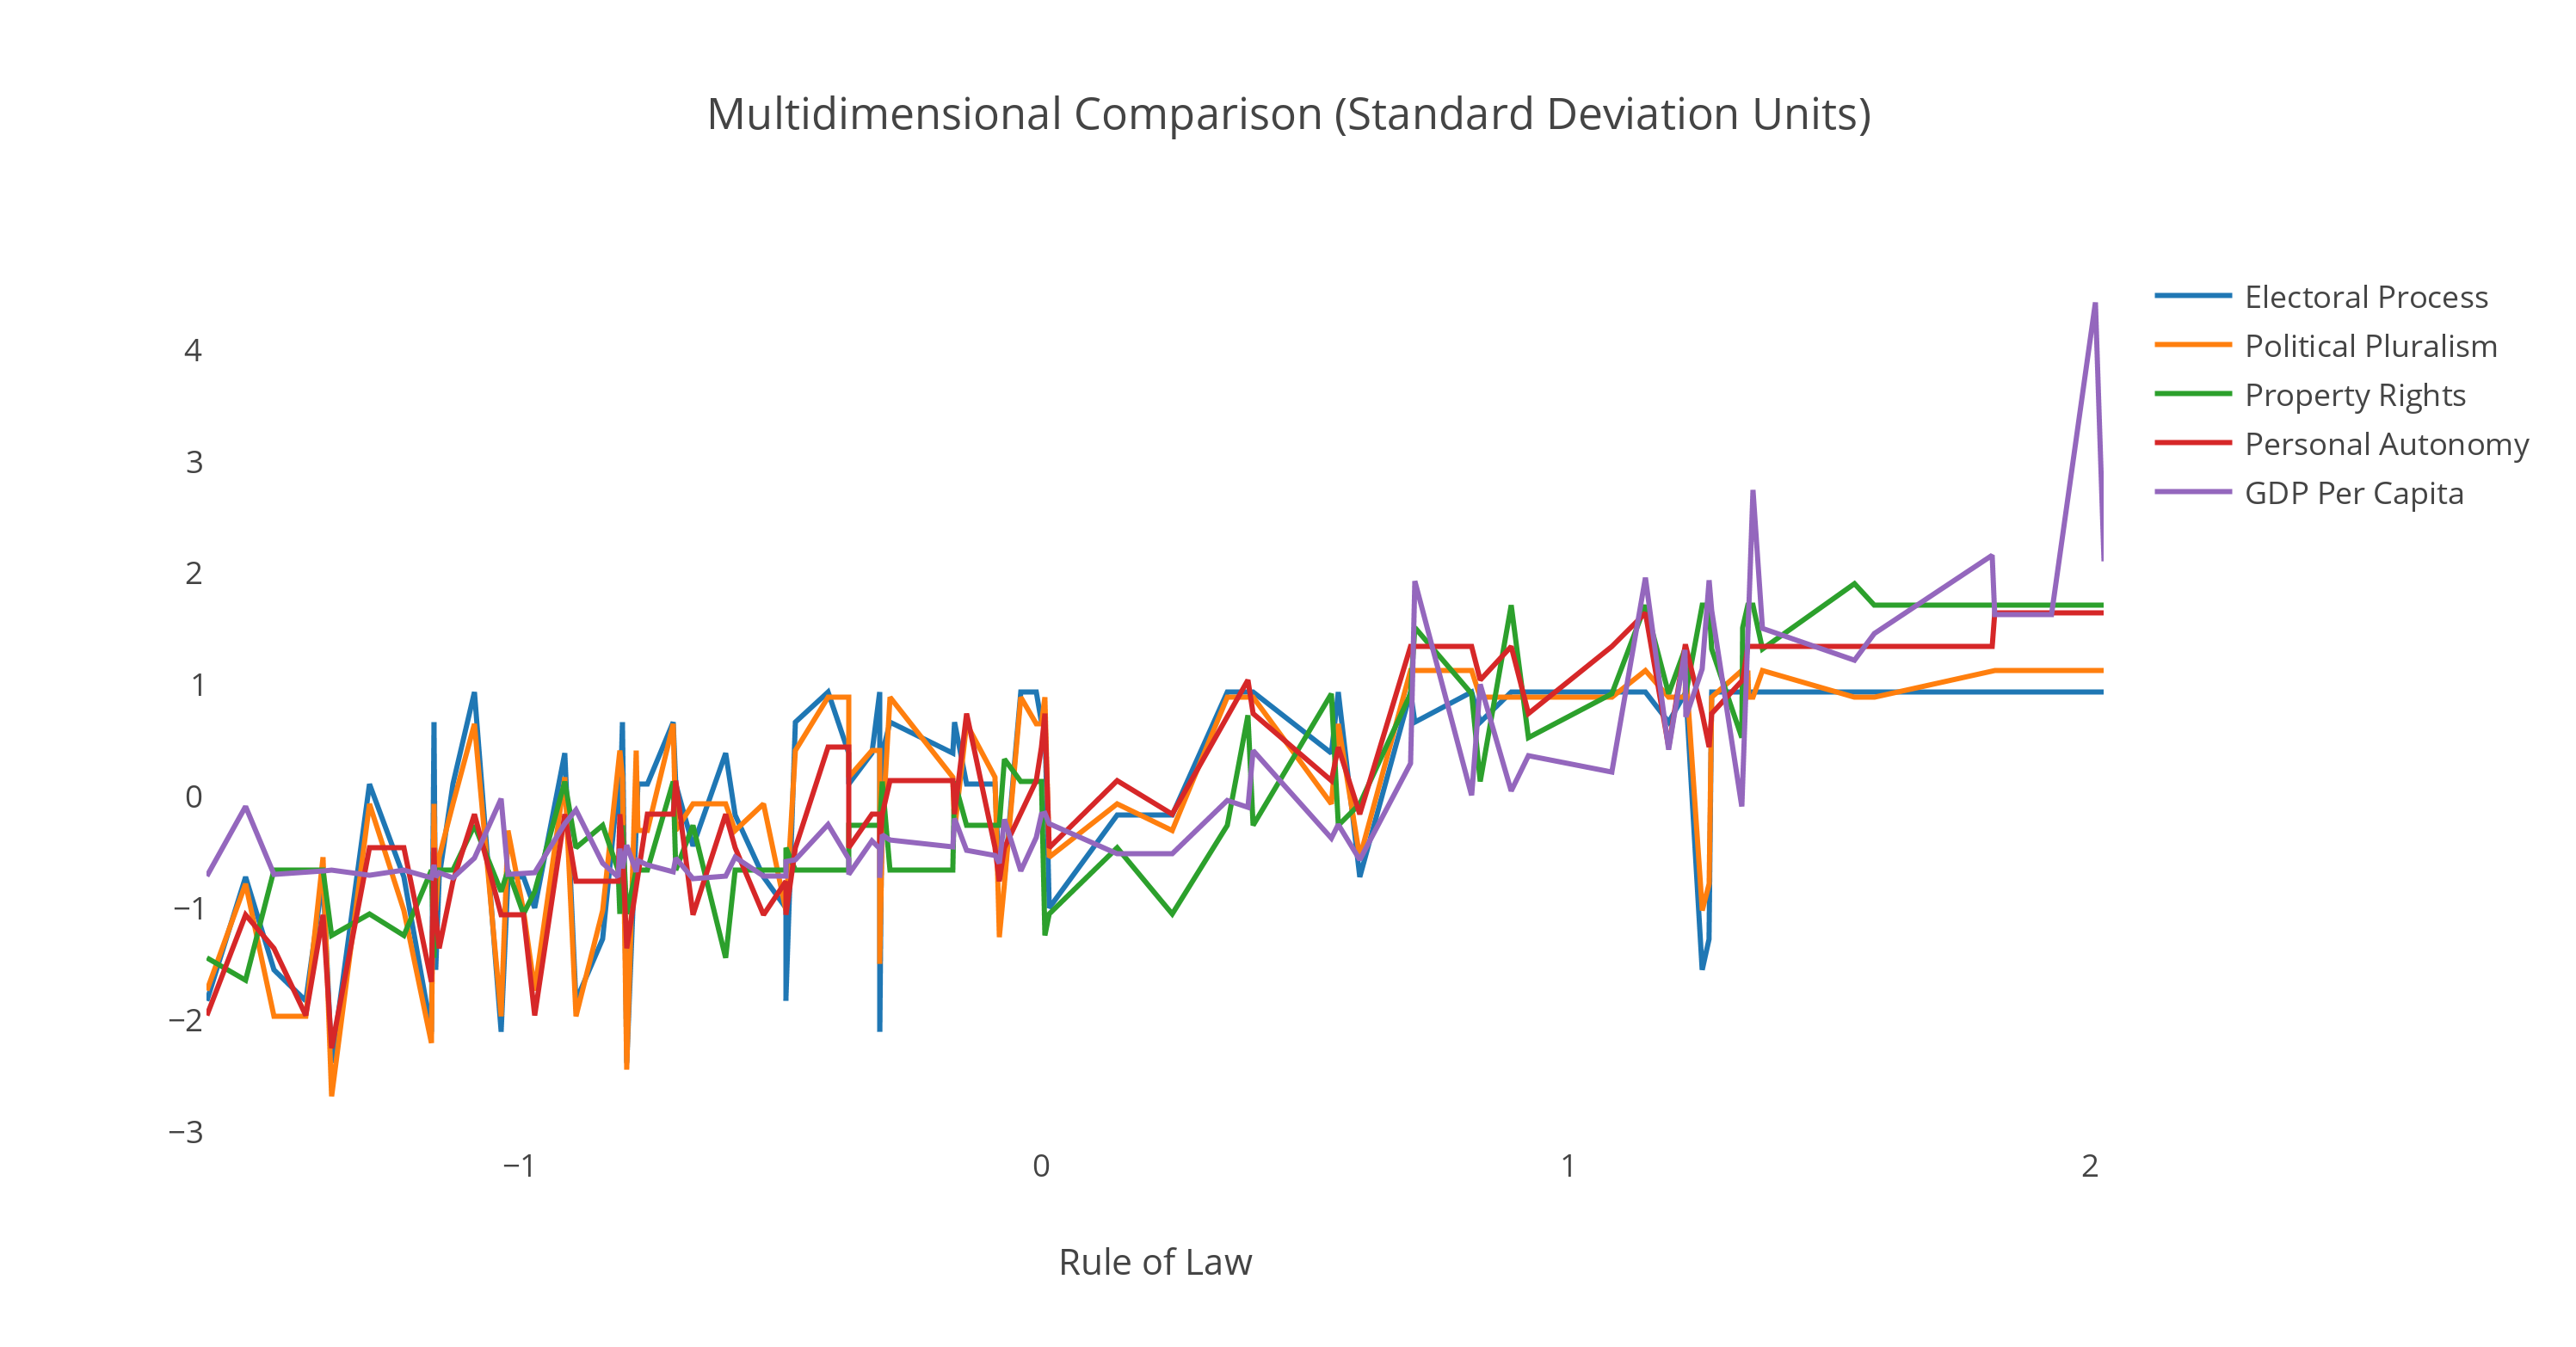
rlrw is a collection of centered and scaled data, including the scores from The Rule of Law in the Real World, same-year scores from the World Bank and Freedom House, World Justice Project subfactor scores (wjp1...8 are the eight main factors from WJP data for 2012), the first principal component of the World Justice Project 2012 scores, and measurements of GDP per capita (World Bank), individual liberty (from Freedom House), property rights protection (Heritage Foundation), and democracy (Freedom House).
rlrw.head()
wjp_bti.head()
# make plotting easier
import matplotlib
matplotlib.rcParams.update({'font.size': 60})
pd.options.display.mpl_style = 'default'
def plot(x, y, dataset):
    dataset.plot(kind='scatter', x=x, y=y, figsize=(20,10), s=200)
# correlation matrix.  GDP appears to work much better on a log scale than on a linear scale.
rlrw[['rol_score','log_gdp','elec_pros', 'per_auto','hprop']].corr()
List of states:
Albania, Argentina, Australia, Austria, Bangladesh, Belgium, Bolivia, Bosnia and Herzegovina, Botswana, Brazil, Bulgaria, Burkina Faso, Cambodia, Cameroon, Canada, Chile, China, Colombia , "Cote d'Ivoire, Croatia, Czech Republic, Denmark, Dominican Republic, Ecuador, Egypt, El Salvador , Estonia, Ethiopia, Finland, France, Georgia, Germany, Ghana, Greece, Guatemala, Hong Kong, Hungary, India, Indonesia, Italy, Jamaica, Japan, Kazakhstan, Kenya, Kyrgyzstan, Lebanon, Liberia, Macedonia, Madagascar, Malawi, Malaysia, Mexico, Moldova, Mongolia, Morocco, Nepal, Netherlands, New Zealand, Nicaragua, Nigeria, Norway, Pakistan, Panama, Peru, Philippines, Poland, Portugal, Romania, Russia, Senegal, Serbia, Sierra Leone, Singapore, Slovenia, South Africa, South Korea, Spain, Sri Lanka, Sweden, Tanzania, Tunisia, Turkey, Uganda, Ukraine, United Kingdom, United States, Uruguay, Uzbekistan, Venezuela, Zambia, Zimbabwe
plot("rol_score", "log_gdp", rlrw)

plot("rol_score", "per_auto", rlrw)

plot("rol_score", "hprop", rlrw)

# democracy does less well
plot("rol_score", "elec_pros", rlrw)

rlrw[["rol_score", "wjppc", "fh_rol", "wb_rol"]].corr()
plot("rol_score", "wjppc", rlrw)

This is good news for measurement: while the World bank and Freedom House measures are less theoretically sound, they seem to serve as pretty good proxies. The World Justice Project really seems to capture the same rule of law ideas that I capture with a subset of their data.
It turns out that the World Justice Project listened---since I did the data analysis for this book (which was several years ago), they also produced a single aggregate score from their factors. It looks (from fairly casual examination) like it just takes a mean of the factors, rather than using any kind of dimensionality reduction technique.
I also would like to look at the BTI. Since there's a 2015 WJP score, which probably covers a similar period to the 2016 BTI, and since I couldn't use the BTI in the previous comparison (as it misses about 20 countries represented in my rule of law score), let's just look at them together.
plot("pca2015", "wjp_overall", wjp_bti)

wjp_bti[["pca2015", "wjp_overall", "bti"]].corr()
It looks like the first principal component of the WJP factors is extremely close to the aggregate score the WJP used. It also looks like it's pretty far away from the BTI's index. In light of the 2012 analysis, this is some (weak) reason to think that the BTI rule of law score ought to be less trusted than the WJP's new aggregate score.
Note that this is based on just the BTI's rule of law subscore, not the entire index score.
# WJP-BTI countries
print ", ".join([x for x in wjp_bti["Country"]])
# can we get any more insight about how the WJP and BTI scores differ?
plot("pca2015", "bti", wjp_bti)

It looks like there's a lot of disagreement as we get to states that score higher with the WJP. Let's see where the disagreement is. The "diffs" variable in here is the absolute difference between the scaled first principal component of the WJP factors and the BTI score.
wjp_bti[["Country", "pca2015", "bti", "diffs"]].sort_values("diffs", ascending=False).head(n=20)
What immediately leaps out from that is that the BTI is substantially more generous with fairly democratic/liberal countries and less generous with fairly undemocratic/illiberal countries---particularly of note here are Singapore, UAE, South Korea, and, in the other direction, India---cases in which, intuitively, the BTI rule of law score tracks liberal-democraticness in general rather than rule of law in particular.
I'm not sure why this should be the case, except perhaps that the comprehensive nature of the BTI's codebook orients the experts whom they survey to thinking about liberal democracy as a whole, rather than the rule of law in particular, even when answering rule of law specific items. Unfortunately, the current country reports do not appear to actually be downloadable from the BTI website.
Conclusions
Equality as justification and basis for development
Theoretically grounded rule of law measures work at least as well as existing leaders, better than others. (But really, trust the WJP)
The Rule of Law in the Real World
https://rulelaw.net
(Use discount code GOWDER16 for 20% off direct from Cambridge until July 1)